“With manual data entry, we lose precious time and struggle to visualize trends. Tourism Selangor needed a system that have real time reports, approvals, and reporting rules all at once.”
— Tourism Selangor
(01)
Overview
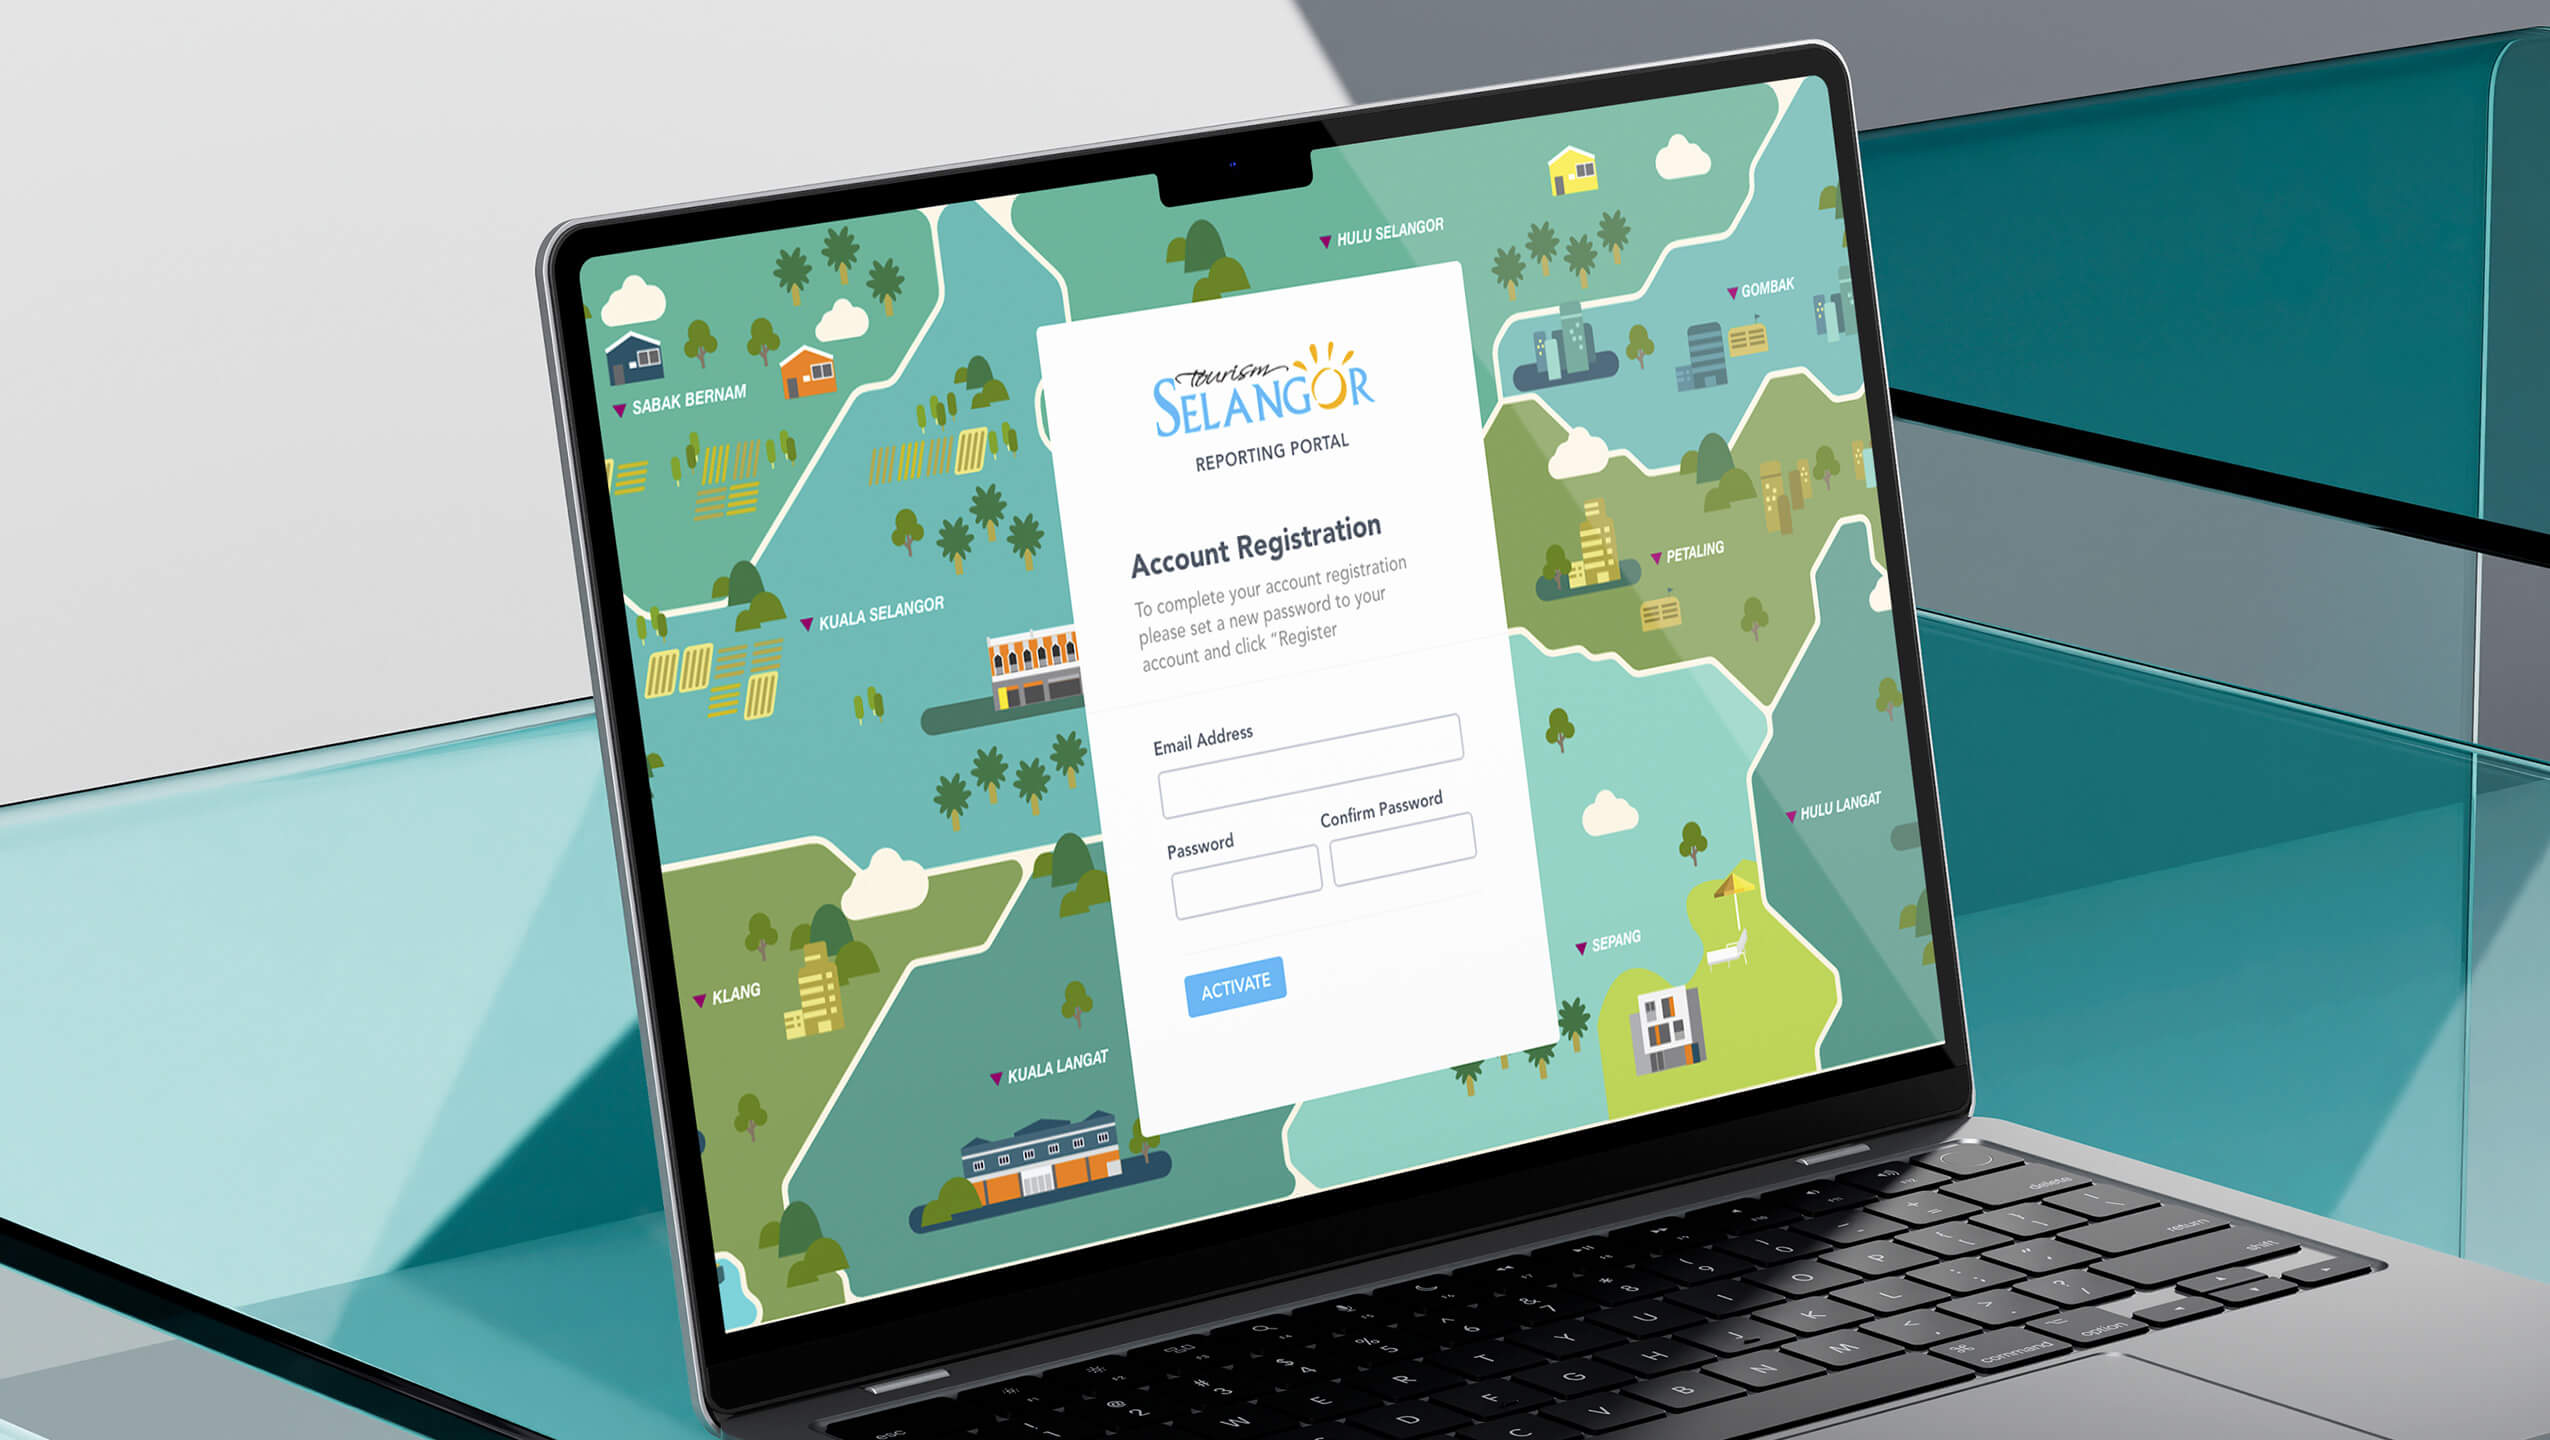
Tourism Selangor required a centralized Reporting Dashboard Portal to aggregate data from over 190 hotels, resorts, homestays, and attractions across 9 districts.
Previously, data was collected manually in Google Sheets, leading to errors, delays, and no real-time visibility. The new system was built using the SweetSpot White-Label CMS, customized to simplify reporting, reduce errors, and empower Tourism Selangor with actionable dashboards for better decision-making.
My Role
Product Designer
Team Involved
- GM
- User Researcher
- Marketing Team
- Developers
- Stakeholders
Responsibilities
- Conducted stakeholder interviews to map pain points of the old Google Sheets workflow.
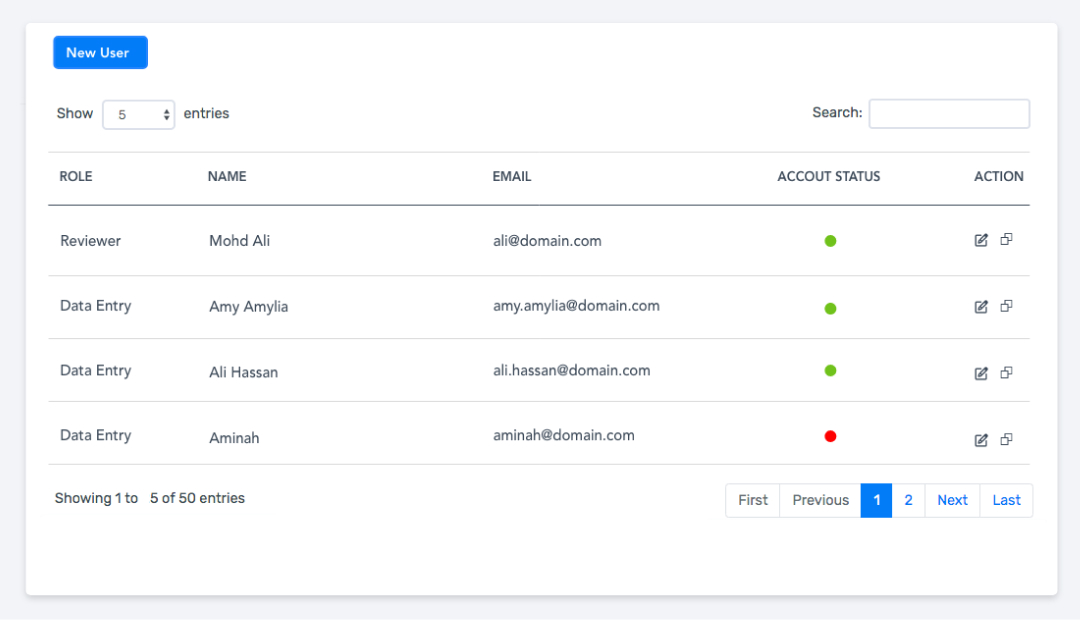
- Defined user roles & access levels (Data Entry, Reviewer, Admin, Municipal).
- Designed high-fidelity dashboards and reporting workflows in Adobe XD.
- Created data visualizations (arrivals, nights stayed, revenue, tourist origins) for admin decision-making.
Goal
- Simplify data collection
- Enable district-level and state-level insights
- Improve decision-making for tourism planning
(02)
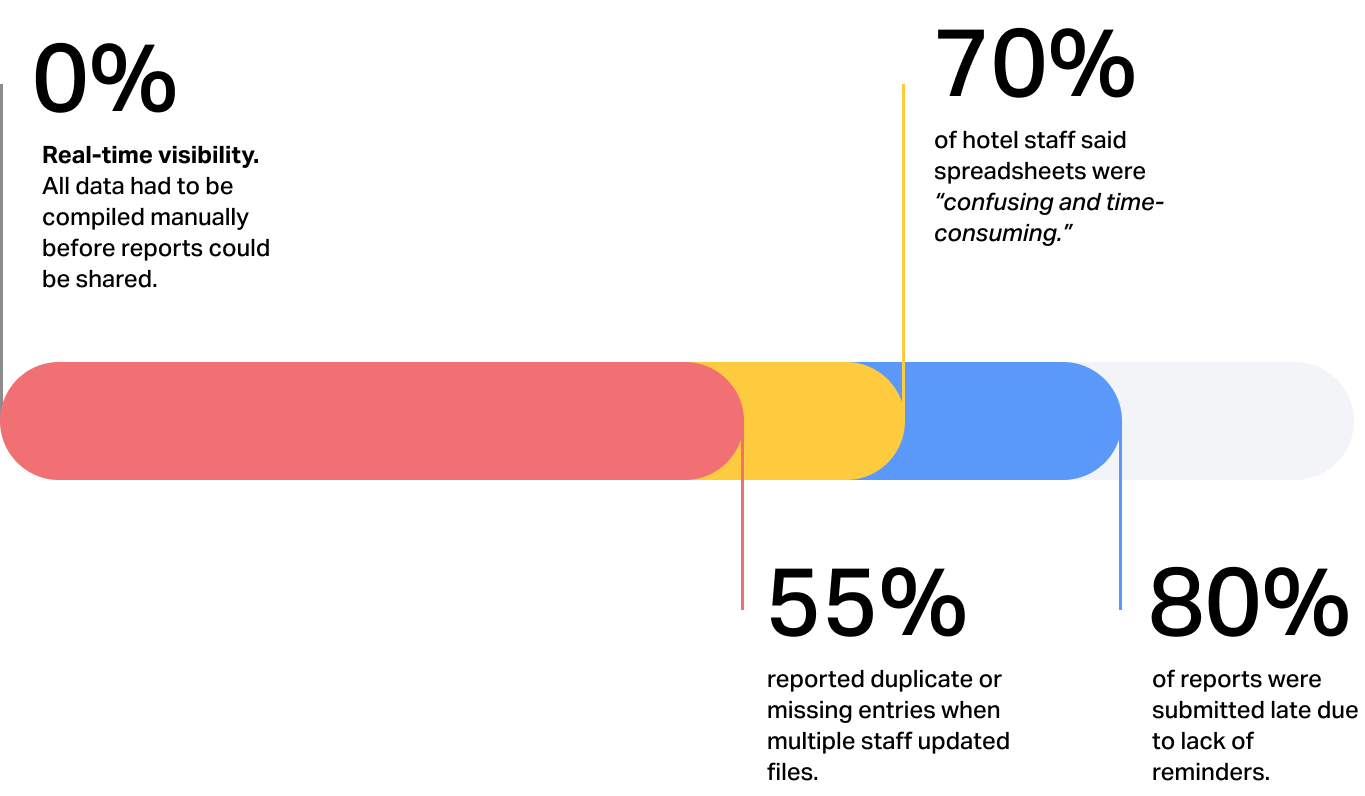
User Research & Problem

“We waste hours updating spreadsheets, and sometimes two people enter the same data twice.” – Hotel Staff
Data Entry User
“It’s impossible to track who has submitted on time. We only find out weeks later when we compile the sheets.”
Reviewer (District Admin)
“Without quick insights, we can’t see trends early enough to plan campaigns.”
Tourism Selangor Admin Solution
Problem
Manual reporting in Google Sheets caused late submissions, duplicate entries, and no way to track real-time progress.
(03)
Solution
Our solution was not a custom build but a strategic SaaS implementation of the SweetSpot White-Label CMS, adapted to Tourism Selangor’s workflows.
Key Features
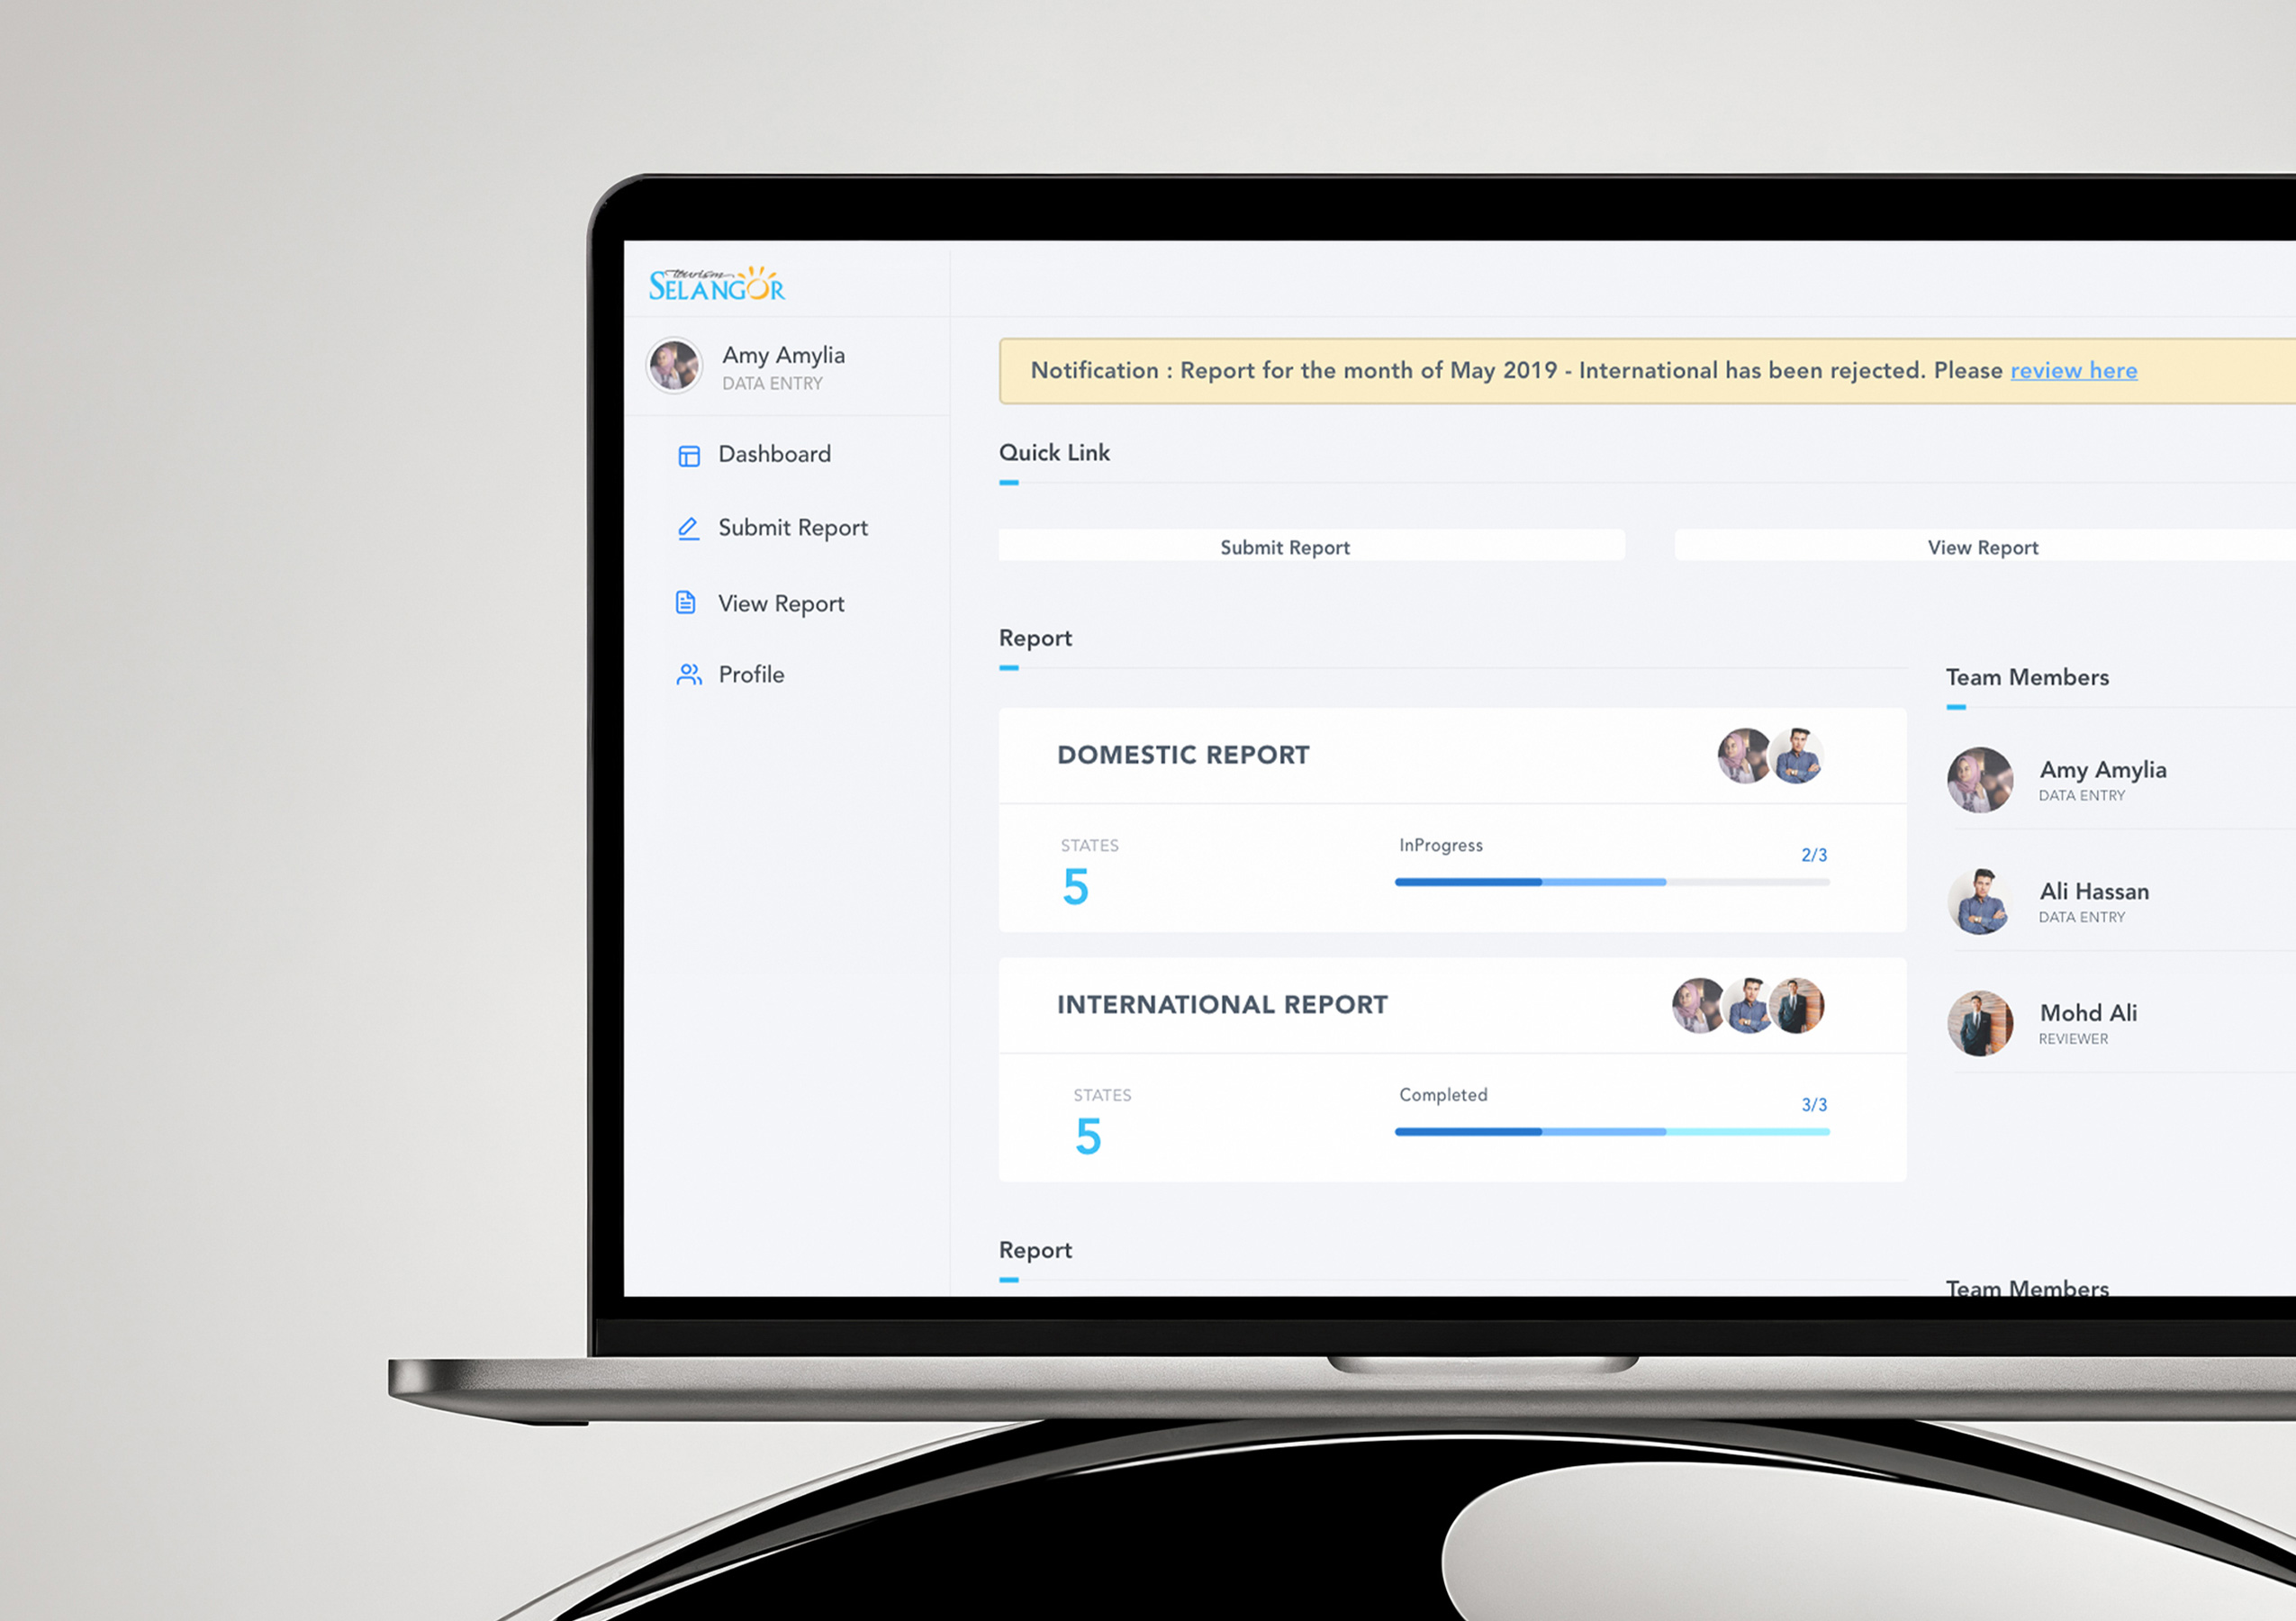
Role-based dashboards
Personalized views for each role, reducing clutter and confusion

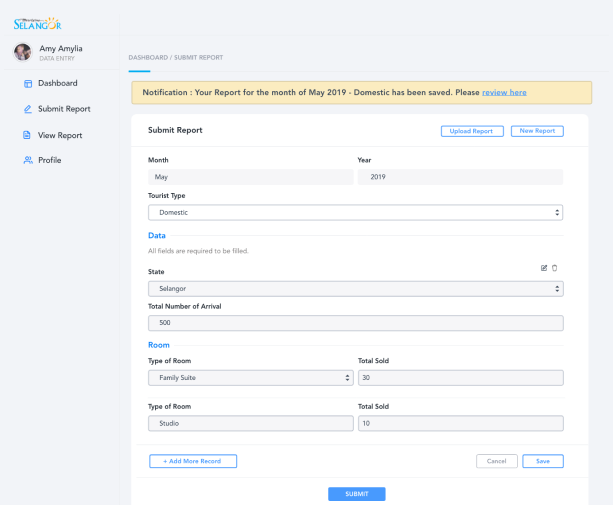
Dynamic forms
Forms adapt based on tourist type, ensuring users only fill in fields relevant to their report, minimizes errors.
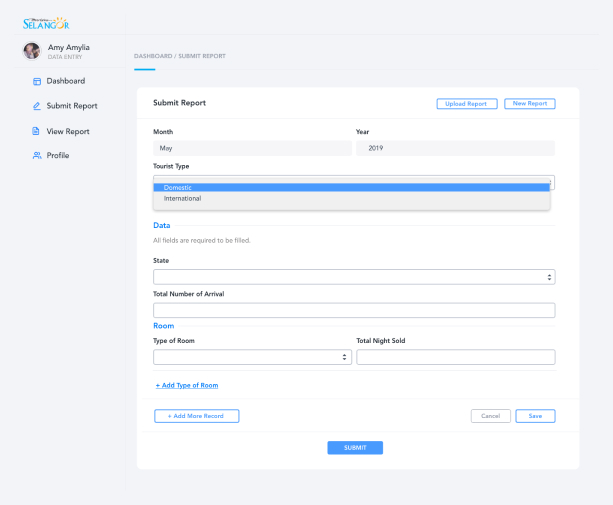
Data entry form for domestic & international arrivals report
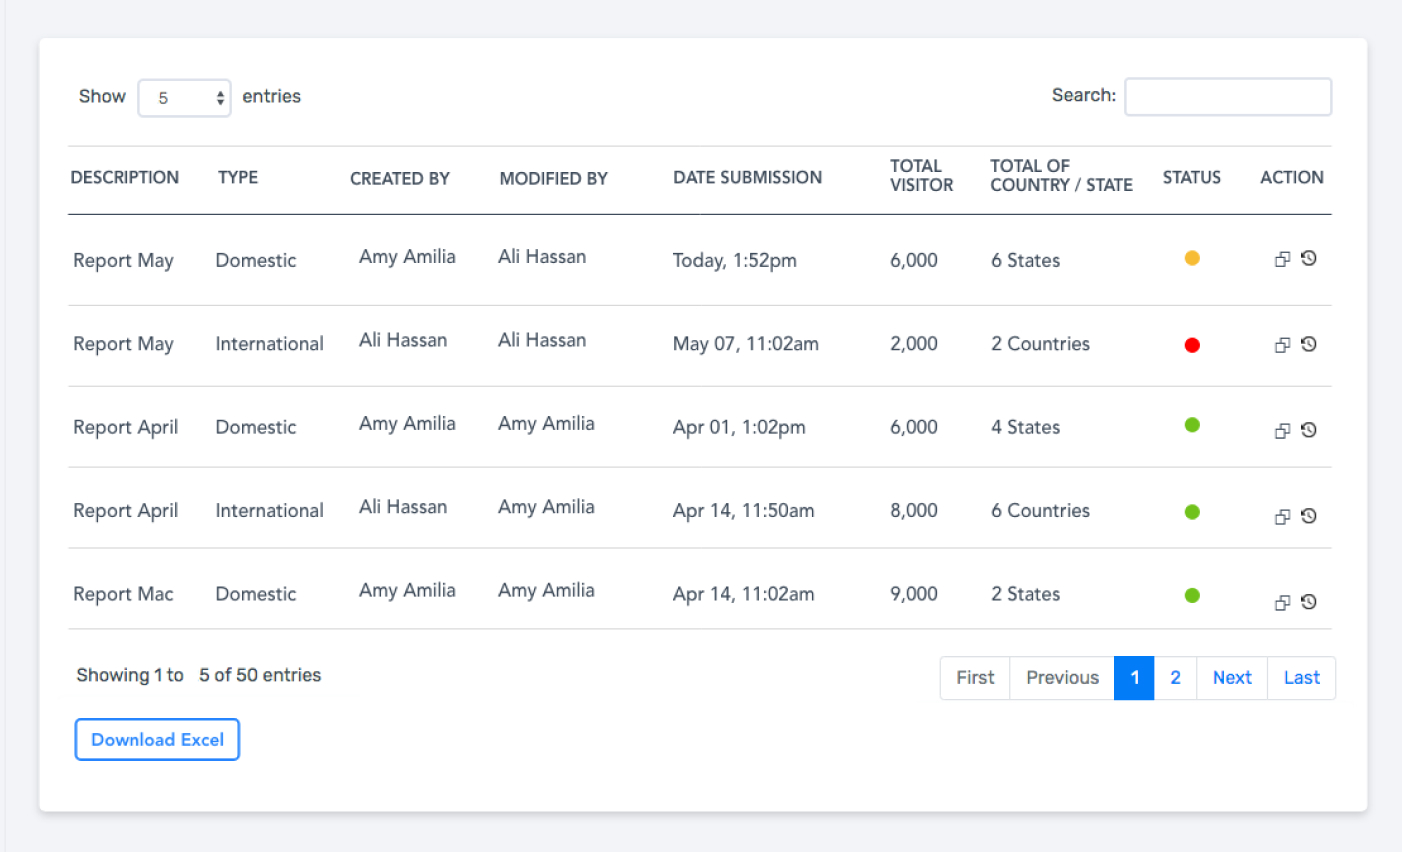
Approval workflow with notifications
Reviewers could approve/reject reports with instant alerts

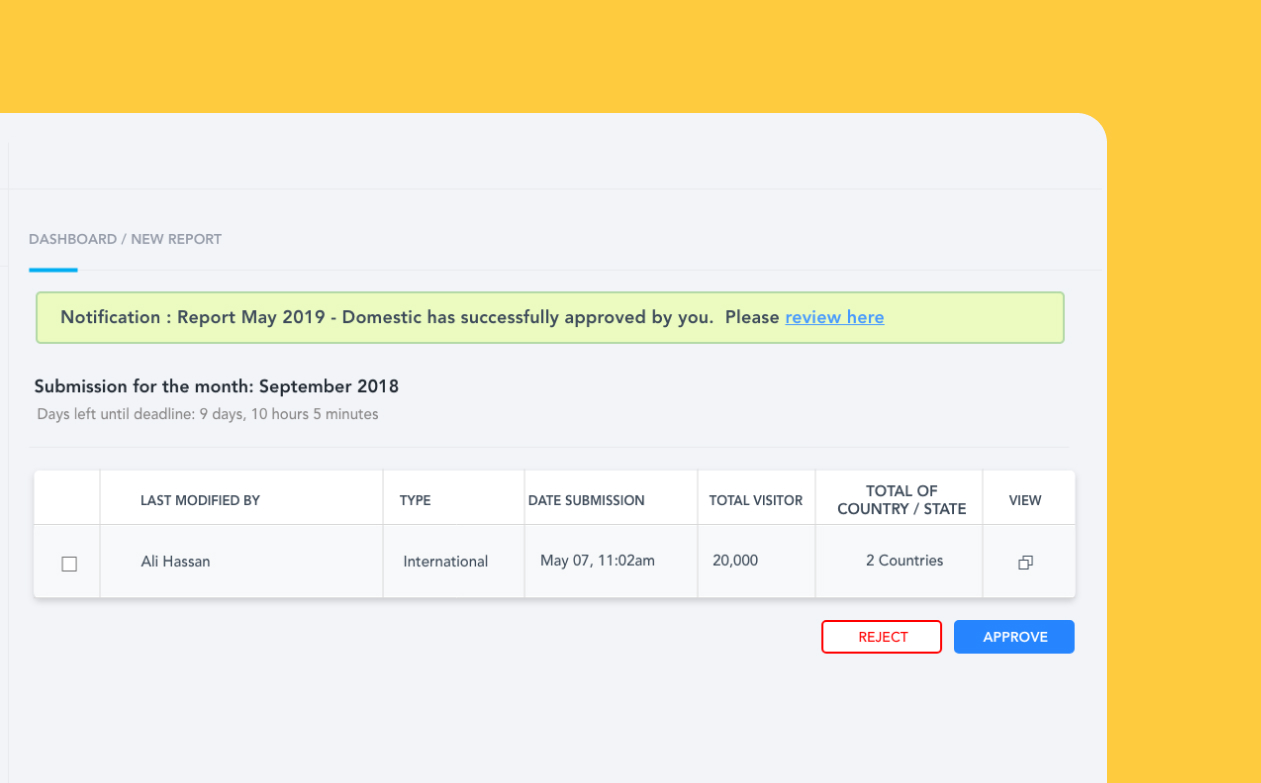
Reviewer dashboard with approval workflow
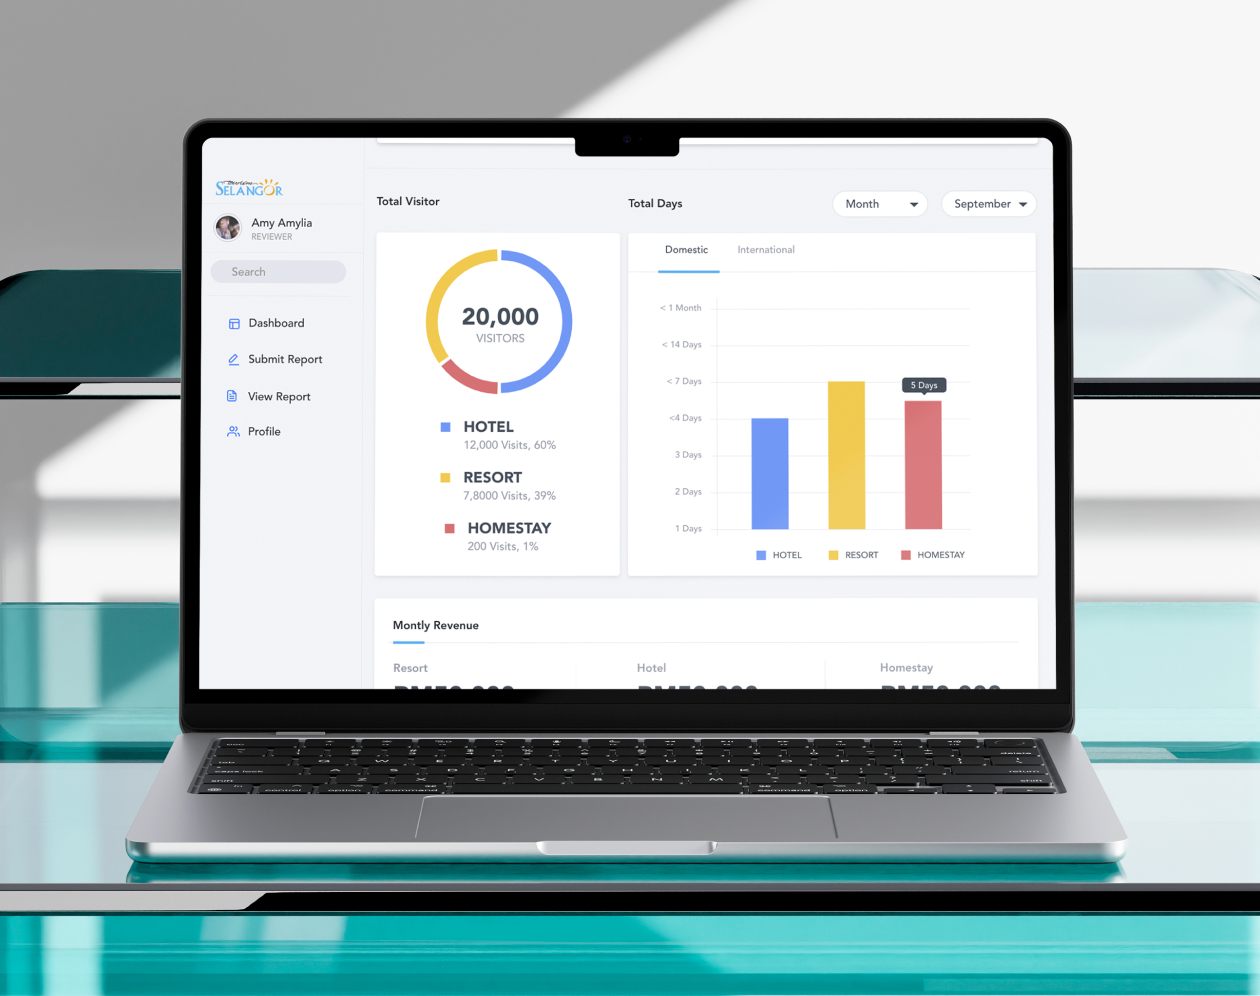
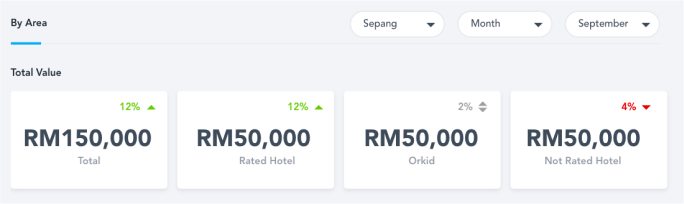
Benchmark
Dashboards provide district level comparisons, including total visitors and revenue by accommodation type (Hotels, Resorts, Homestays)
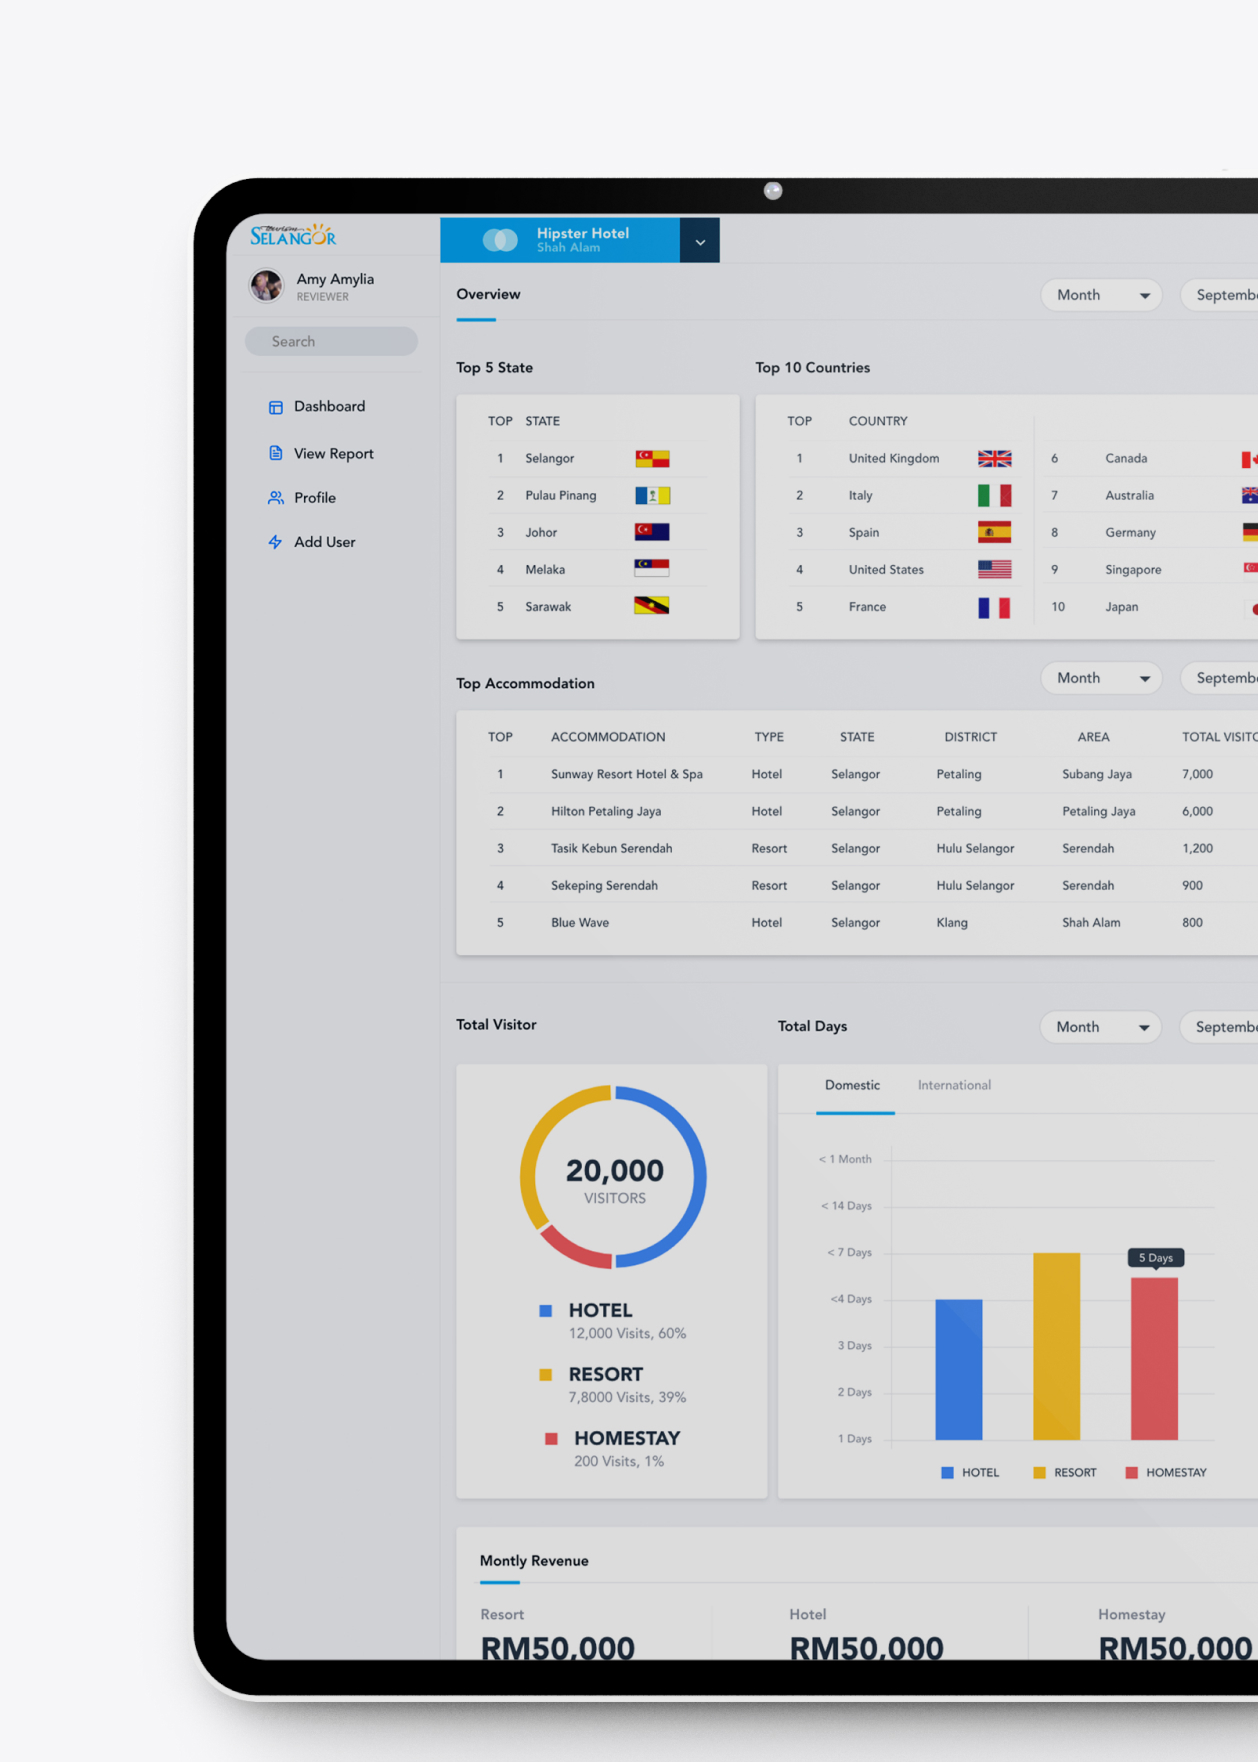
Admin dashboard visualizing arrivals by month
(04)
Process & Timeline
Because this was a white-label SaaS adaptation, the focus was on customization, UI/UX design, and usability validation.
Discovery
2 Weeks
- Stakeholder interviews with Tourism Selangor
- Mapping the old Google Sheets process and identifying pain points
Customization Planning
1 Week
- Matching SweetSpot CMS modules to Selangor’s reporting workflow
- Defining user roles & access levels
UI/UX Design
2 Weeks
- Designed dashboards, submission flows, and approval workflows
- Created high-fidelity prototypes in Adobe XD
Testing & Iteration
2 Weeks
- Usability testing with Tourism Selangor staff
- Iterated flows to simplify navigation and reduce errors
Handoff & Implementation
3 Days
- Delivered annotated UI specs to developers
(05)
UI Design
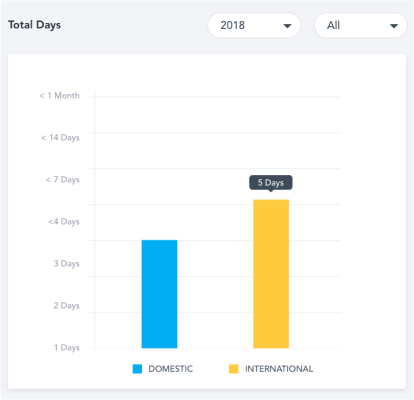
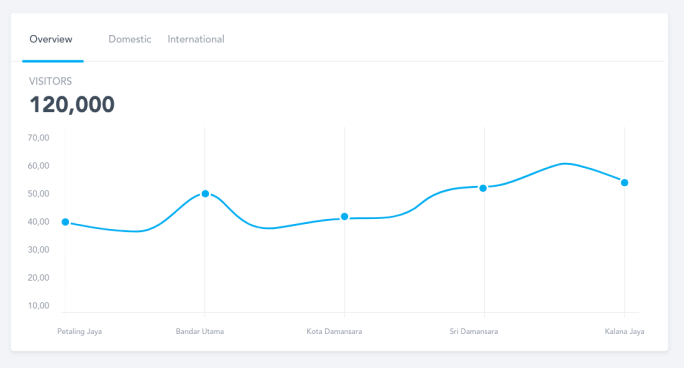
Data visualization
Clear charts for arrivals, nights stayed, and revenue trends
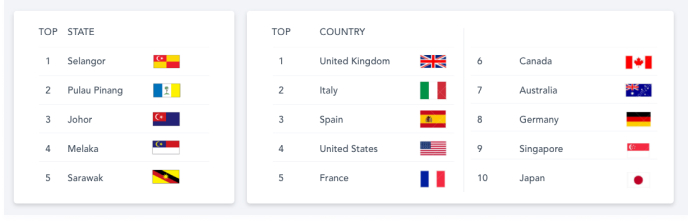
Top origin
Highlighted top origin countries/states for quick insights
Submission status tracking
Improved accountability by showing submitted vs. pending reports
Role-based navigation
Each user type only saw what they needed, reducing confusion


(06)
Impact and result
The new portal replaced manual spreadsheets with an automated, scalable system.
Outcomes (Estimated)
60%
faster data collection
45%
faster reporting turnaround with real-time dashboards
35%
fewer late submissions due to automated reminders
30%
fewer errors with validation & approval workflows
(06)
Outcome
The final design ensured that even non-technical users could easily submit, review, and analyze data.
Tourism Selangor now has a single source of truth for tourism arrivals, enabling authorities to:
- Track submissions in real-time
- Visualize domestic & international trends instantly
- Make faster, data-driven decisions that shape tourism strategy across Selangor